Neka Railway Bridge Load Test Client : IRAN Transportation Research Center Consultant : The Educational chancellor of the School of Railway Engineering, Iran University of Science and Technology (IUST) Contractor : Dr. Sa’eed Mohammad Zadeh 
pic.1 
pic.1.B 
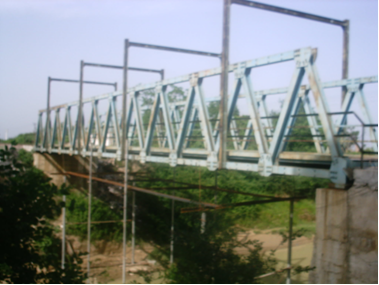
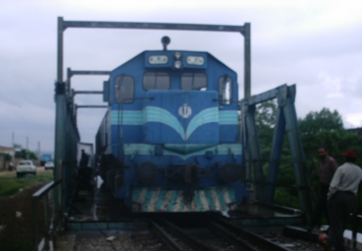
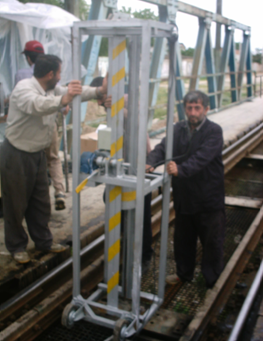
pic.1.c Neka truss bridge with a span of 36 m. is located in north district of the railway network of Iran. It is located 300 m far from Neka station in Mazandaran province. The truss composed of twelve 3-meter bays with the height and width of 3.3 and 5.5 m., respectively. With such features, the truss provides an adequate space for one railway track to pass over Neka River (Picture 1). In the present test, 89 sensors were utilized (acceleration in 27 points, deflections in 20 points, and strains in 42 points). The first test was conducted with a 120-ton diesel alone. In the second test, the diesel attached with two 80-ton freight wagons passed over the bridge with a speed of 5 to 55 km/h (Picture 1.B). Twenty series of tests were carried out by exploiting a 48-channel dynamic data logger with the sampling rate of 2000 input data/second/channel; 22 series of tests were performed by exploiting a 98-channel static data logger with the data acquisition rate of 20 input data/second/channel. The maximum load in both tests reached 120 and 215 tons, respectively. Moreover, in order to obtain free vibration frequencies and the mode shape of the structure, the impact test was carried out on the bridge and the bridge free vibration data were analyzed. The impact loading was conducted by releasing a 35-kg weight from a 1.65 height which hit into the middle of transverse floor beam (Picture 1.C). All the transverse floor beams of the deck were separately hit by the impact. The data were measured by the dynamic data recorder set with a sampling frequency of 2 kHz. From the collected data, the natural frequency and the mode shape of the structure were identified. Test movie: 1. Drawing the as-built map of the bridge 2. Erecting the scaffold 3. Attaching the strain gauge 4. Attaching accelerometer 5. Attaching LVDT 6. Attaching sensors to the data logger 7. Measuring the deflections through survey 8. Calibrating the sensors 9. Field static loading 10. Field dynamic loading 11. Impact loading |